OKX: MA CrossoverEXAMPLE Scripte from my stream , how to use OKX webhooks for create strategy on Pine with real\demo trading on your OKX account. This strategy only for test the functional forward orders to OKX. The backtest not included commisions and other.
OKX MA Crossover. This strategy generate JSONs for place orders on the exchange by alerts and webhooks.
In the script 2 function to generate entry and exit orders, and input parameters that needed for setup exchange.
Use it for test this stack and to write you own strategy for trade on the OKX Exchange.
Cari dalam skrip untuk "the script"

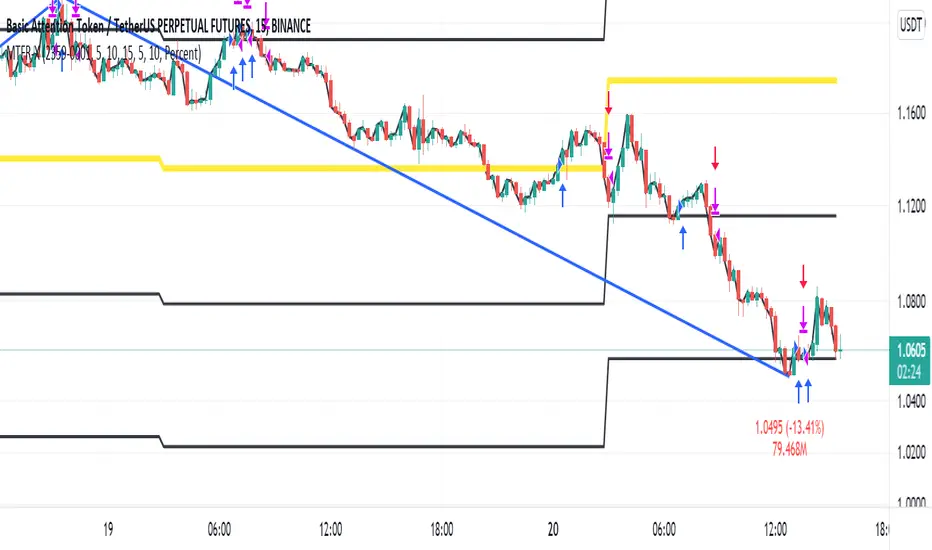
ALMA/EMA/SRSI Strategy + IndicatorBack with another great high hit rate strategy!!
Disclaimer* This strategy was sampled using source code written by @ClassicScott , as referred to in the script, there is a clear line where the source code was scripted by myself.
This Strategy consists of three key factors, the ALMA, EMA crossover, and a Stochastic Rsi
ALMA: The Alma is the step line shown, turning green and red at select times. This average value gives general oversight of the macro movement of price action. and this particular one was coded by Mr.ClassicScott.
EMA crossover: At the input screen you are given an option of the fast and slow ema's. The default is solely for the hit rate and correlation to the Alma of this strategy. The arrows you see depicted on the chart are the crossover events happening.
Stochastic Rsi: The Stochastic Rsi is a stochastic value, using data sampled from the rsi. The use of this indicator in my strategy is to prevent entries when too overbought and oversold, as well as closures and vice versa, to prevent holding bags either way.
Fixed % TP: In the input screen you are given a take profit and stop loss percentage, for good R/R the hit rate will take a notch down, but with no R/R it will be near perfect.
How to use this:
Add it to your chart to get the strategy inputs. (The strategy is really only useful on a 15min TF. However the indicator within it can be used on anything at anytime!)
Watch the yellow and aqua moving averages, these are your ema's and crossover's will trigger signals based on your integer inputs.
Find Correlation between other leading indicators, as well as crossover's down/up and a red/green alma.
DO NOT use the arrows as buy/sell signals. These are simply to show ema's are crossing under or over. Momentum indicator's paired with this can be useful to determine if it could be a buy signal or sell signal.
Cheat Code's Notes:
Almost at 1000 boosts!!! I appreciate the support from everyone and I will keep trying my best to deliver quality strategies for the people.
-Cheat Code
BYBIT:BTCUSDT

Strategy Oil Z ScoreObjective is to find forward looking indicators to find good entries into major index's.
In similar vein to my Combo Z Score script I have implemented one looking at oil and oil volatility. Interestingly the script out performs WITHOUT applying the EMA in longer timeframes but under performs in shorter timeframes, for example 2007 vs 2019. Likely due to the bullish nature of the past decade (by and large). You have some options on the underlying included Oil vs OVX (Best), MOVE vs OVX and VIX vs OVX. Oil vs OVX out performs Combo Z Script. Favours Spy over QQQ or derivations (SPXL etc).

5min Williams Fractals scalping (3commas)Another strategy I'm learning Pine Script on. It is inspired by a MoneyZG youtube strategy called "Easy 5 Minute Scalping Strategy (Simple to Follow Scalping Trading Strategy)".
Again this is a one order per trade strategy compatible with the 3commas bot (works also with the free 3commas subscription). This strategy is based on the signals from Williams Fractals, taking the signals in reverse - red triangle indicates a bottom and hence we go long. The green triangle indicates a top so we go short. By default these signals are only accepted if they occur between the two Emas. However, you can also turn this off and when a WF signal comes in, only the current price has to be between the Emas. Stop loss is set to the current Ema slow and the take profit is a multiple of the distance to the slow ema.
Like previously I have added different filters as well as the ability to view essential things like the WF signal and Emas. I hope the script will help you to be more successful and if so it would be great if you could share here your setups, or tips on what would be good to refine to make it an even a more profitable strategy. Kind of a community approach so that we help each other out :).
Instructions for the 3commas connector:
1. First, you need to prepare 3commas Long/Short bots that will only listen to custom TV signals.
2. Inputs for the 3commas bot can be found at the end of the user inputs.
3. Once you have entered the required details into the inputs, turn on 3commas comments. They should appear on the chart (looks messy).
4. Now you can add the alert where you should paste the 3commas Webhook URL: 3commas.io
5. For the alert message text insert the placeholder {{strategy.order.comment}} and delete the rest.
6. Once the alert is saved, you can turn off those 3commas comments to have a clearer chart.
7. With a new alert, the bot and trade should launch.
In the near future I would like to publish more scripts that will carry similar elements as the first two, incl. compatibility with 3commas (I don't have access to another bot system). I will choose some strategies myself, but I will also be glad for some tips on what strategy would be good to do and is still missing here on Tradingview (short youtube videos or brief strategy manuals would be great).
Thanks and keep it up
PS: My screen values starting at Long Target Profit and ending at Pullback NOT greater than: 1.5; 1.5; 0; ON; 1; 2; OFF; 17; 36; ON; 0.05; ON; Chart; 14; 46; 50; 48.5; 51; OFF; 1; ON; 4; 2.

A.I.Driven TradersAI Model Trades for 20190612The entry and exit levels here are NOT derived from any specific indicator but are coming from our A.I. driven proprietary models.
This is an attempt at exploring the trading community here at TradingView and sharing our daily trading plans published at our site with the community here in the form a Pine Script - just starting and learning this platform. Please help point out any obvious errors or gotchas committed in the scripts. Thanks and have a great trading day!
**** The Trading Plan Published for today ****
>>>> Medium-Frequency Models: <<<<< For today, Wednesday 06/12, our medium-frequency models indicate using the 2895 as a pivot point - opening a long on a break above 2895, and opening a short on a break below 2895 (wait for a close on at least a five minute chart to determine the break), both sides with a 9-point trailing stop.
Note: For the trades to trigger, the breaks should occur during the regular session hours starting at 9:30am ET. By design, these models do NOT open any new positions after 3:45pm. Only one open position at any given time.
>>>>> Aggressive Intraday Models: <<<<< For today, Wednesday 06/12, our aggressive intraday models indicate going long on a break above 2892 or 2875 with an 6-point trailing stop, and going short on a break below 2887 or 2878 with an 8-point trailing stop.
Note: For the trades to trigger, the breaks should occur during regular session hours starting at 9:30am ET. Due to the intraday nature of these aggressive models, they indicate closing any open trades at 3:55pm and remaining flat into the session close. No opening of new positions after 3:45pm. Only one open position at any given time.

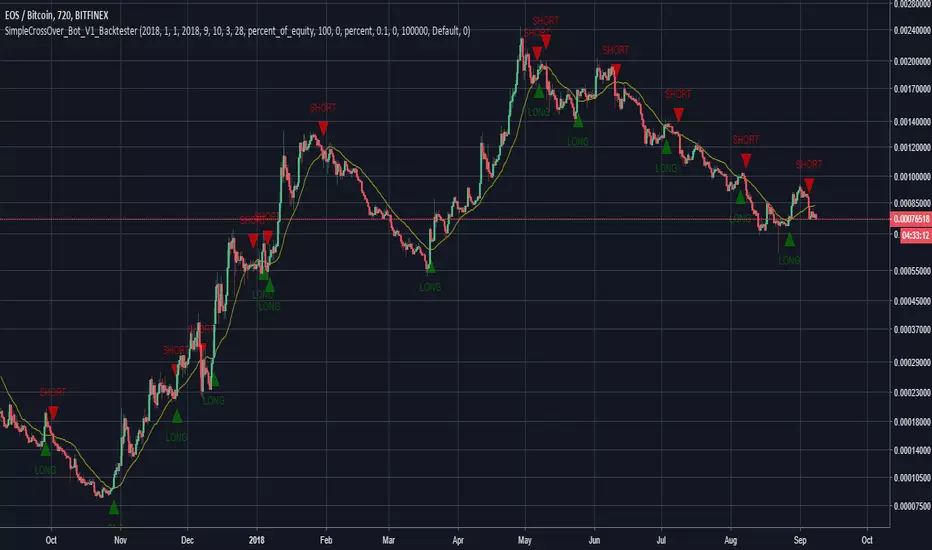
SimpleCrossOver_BotThis is a simple example of how you can compile your own strategy
This script contains the code for alerts and for backtesting.
In order to use the backtester, comment out the sections to be used for signals, and comment in the sections to be used on the back tester, and visa versa for using the script for alerts in order to automate your own bot.
MP ZeroLag EMANew script based on zlema. Hopefully responds better tot ake advantage of margin trading. As usual, commands for both spot trading and margin trading are included, just need to comment or uncomment (using // ) which you prefer. They are just labels so both work in the same way (long/buy, short/sell). Also added some flair to pretty it up a bit, and yes, those divergences are in fact functional, but not really part of the script (disclosure- the divergences are taken from DonovanWall's ideas, full credit here). There is a "new stuff" section, which you CAN use, but right now it was for art and introduced way too many functions at once to be of any use, but feel free to explore as an Easter Egg :)
Autoview friendly in design :)
As usual, all proceeds go to the betterment of these scripts as well as my upcoming surgery (Carpel Tunnel Syndrome, yuck)
1Dsg49Zt2FQ9BnUHrmXQwvhL5dd3teqa7g
ltc addy- LYUpgsHSHnKeYdNaj9bu9prK4QsnJXEQtP
pinkcoin addy- 2PoeXyAk3rF9FmMC8azme2mGzMYsEiZ5eS

C320up Strategy Tester Start TimeC320up Strategy Tester Start Time
This is a little snippet you can paste into your Strategy to set the testing start date and time.
It is not a Strategy per se, though is an example with the timestamp script included.
Instructions are fairly straight forward, and are listed in the script.
If for some reason you also wanted an end date, that too is possible. Just leave a note in the comments.
Disclaimer: We searched for a similar script on TV, and could not find anything at this point in time.
You can set your preferred date and time in the input section of the settings.
Enjoy!

1M XAU Cumulative Delta Volume with OB Breakouts
### Overview
This is a **session-based CVD strategy** built around the **00:00–07:00 CEST range**. It finds the high/low of that session, turns them into **adaptive ATR-based support (yellow)** and **resistance (purple)** zones, and trades only **CVD-confirmed reversals** off those levels.
---
### How it Works
* For each day, the script:
* Builds a 00:00–07:00 CEST **profile high/low**.
* Creates a **support zone** around the session low and a **resistance zone** around the session high.
* Using lower timeframe data, it reconstructs **Cumulative Volume Delta (CVD)** and a **recent delta** filter.
* It arms “pending” states when price **enters a zone from the correct side**, then confirms:
* **BUY (long):** price reclaims above support and recent CVD is strongly positive.
* **SELL (short):** price rejects below resistance and recent CVD is strongly negative.
Only these two CVD signals (`buySignal` / `sellSignal`) open trades.
---
### Strategy Logic
* **Entries**
* `buySignal` → open **long** (if flat).
* `sellSignal` → open **short** (if flat).
* No pyramiding; one position at a time.
* **Exits (only TP & SL)**
* Long: TP at `avg_price * (0.5 + TP%)`, SL at `avg_price * (1 – SL%)`.
* Short: TP at `avg_price * (0.5 – TP%)`, SL at `avg_price * (1 + SL%)`.
* No opposite-signal exits.
---
### Extras
* **Reversal markers** on yellow/purple zones and **breakout/retest markers** are plotted for context and alerts but **do not trigger entries**.
* Zone width and “thickening” are ATR-based so important touches and near-touches are easy to see.
* Only suited for **1m intraday scalping** (e.g. XAU/USD), but can be tested on other markets/timeframes.

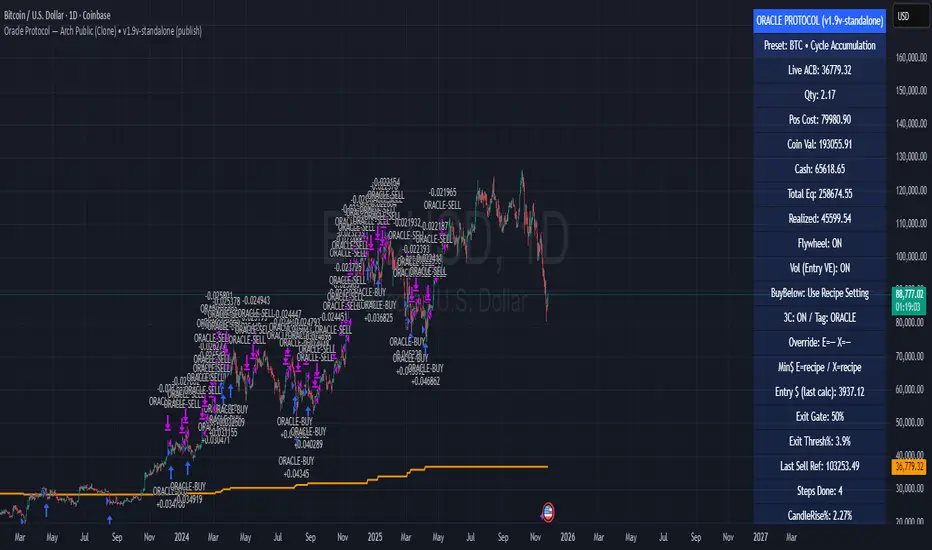
Oracle Protocol — Arch Public (Testing Clone) Oracle Protocol — Arch Public Series (testing clone)
This model implements the Arch Public Oracle structure: a systematic accumulation-and-distribution engine built around a dynamic Accumulation Cost Base (ACB), strict profit-gate exit logic, and a capital-bounded flywheel reinvestment system.
It is designed for transparent execution, deterministic behaviour, and rule-based position management.
Core Function Set
1. Accumulation Framework (ACB-Driven)
The accumulation engine evaluates market movement against defined entry conditions, including:
Percentage-based entry-drop triggers
Optional buy-below-ACB mode
Capital-gated entries tied to available ledger balance
Fixed-dollar and min-dollar entry rules (as seen in Arch public materials)
Automated sizing through flywheel capital
Range-bounded ledger for controlled backtesting input
Each qualifying buy updates the live ACB, maintains the internal ledger, and forms the next reference point for exit evaluation.
No forecasting mechanisms are included.
2. Profit-Gate Exit System
Exits are governed by the standard Arch public approach:
A sealed ACB reference for threshold evaluation
Optional live-ACB visibility
Profit-gate triggers defined per asset class
Candle-confirmation integration (“ProfitGate + Candle” mode)
Distribution only when the smallest active threshold is met
This provides a consistent cadence with published Arch diagrams and PDFs.
3. Once-Per-Rally Governance
After a distribution, the algorithm locks until price retraces below the most recent accumulation base.
Only after re-arming can the next profit gate activate.
This prevents over-frequency selling and aligns with the public-domain Oracle behaviour.
4. Quiet-Bars & Threshold Cluster Control
A volatility-stabilisation layer prevents multiple exits from micro-fluctuations or transient spikes.
This ensures clean execution during fast markets and high volatility.
5. Flywheel Reinvestment
Distribution proceeds automatically return to the capital pool where permitted, creating a closed system of:
Entry sizing
Exit proceeds
Ledger-managed capital state
All sizing respects capital boundaries and does not breach dollar floors or overrides.
6. Automation Hooks and Integration
The script exposes:
3Commas-compatible JSON sizing
Entry/exit signalling via alertcondition()
Deterministic event reporting suitable for external automation
This allows consistent deployment across automated execution environments.
7. Visual Tooling
Optional displays include:
Live ACB line
Exit-guide markers
Capital, state, and ledger panels
Realized/unrealized outcome tracking based on internal logic only
Visual components do not influence execution rules.
Operating Notes
This model is rule-based, deterministic, and non-predictive.
It executes only according to the explicit thresholds, capital limits, and state transitions defined within the script.
No discretionary or forward-looking logic is included.
ATH대비 지정하락률에 도착 시 매수 - 장기홀딩 선물 전략(ATH Drawdown Re-Buy Long Only)본 스크립트는 과거 하락 데이터를 이용하여, 정해진 하락 %가 발생하는 경우 자기 자본의 정해진 %만큼을 진입하게 설계되어진 스트레티지입니다.
레버리지를 사용할 수 있으며 기본적으로 셋팅해둔 값이 내장되어있습니다.(자유롭게 바꿔서 쓰시면 됩니다.) 추가적으로 2번의 진입 외에도 다른 진입 기준, 진입 %를 설정하실 수 있으며 - ChatGPT에게 요청하면 수정해줄 것입니다.
실제 사용용도로는 KillSwitch 기능을 꺼주세요. 바 돋보기 기능을 켜주세요.
ATH Drawdown Re-Buy Long Only 전략 설명
1. 전략 개요
ATH Drawdown Re-Buy Long Only 전략은 자산의 역대 최고가(ATH, All-Time High)를 기준으로 한 하락폭(드로우다운)을 활용하여,
특정 구간마다 단계적으로 롱 포지션을 구축하는 자동 재매수(Long Only) 전략입니다.
본 전략은 다음과 같은 목적을 가지고 설계되었습니다.
급격한 조정 구간에서 체계적인 분할 매수 및 레버리지 활용
ATH를 기준으로 한 명확한 진입 규칙 제공
실시간으로
평단가
레버리지
청산가 추정
계좌 MDD
수익률
등을 시각적으로 제공하여 리스크와 포지션 상태를 직관적으로 확인할 수 있도록 지원
※ 본 전략은 교육·연구·백테스트 용도로 제공되며,
어떠한 형태의 투자 권유 또는 수익을 보장하지 않습니다.
2. 전략의 핵심 개념
2-1. ATH(역대 최고가) 기준 드로우다운
전략은 차트 상에서 항상 가장 높은 고가(High)를 ATH로 기록합니다.
새로운 고점이 형성될 때마다 ATH를 갱신하고, 해당 ATH를 기준으로 다음을 계산합니다.
현재 바의 저가(Low)가 ATH에서 몇 % 하락했는지
현재 바의 종가(Close)가 ATH에서 몇 % 하락했는지
그리고 사전에 설정한 두 개의 드로우다운 구간에서 매수를 수행합니다.
1차 진입 구간: ATH 대비 X% 하락 시
2차 진입 구간: ATH 대비 Y% 하락 시
각 구간은 ATH가 새로 갱신될 때마다 한 번씩만 작동하며,
새로운 ATH가 생성되면 다시 “1차 / 2차 진입 가능 상태”로 초기화됩니다.
2-2. 첫 포지션 100% / 300% 특수 규칙
이 전략의 중요한 특징은 **“첫 포지션 진입 시의 예외 규칙”**입니다.
전략이 현재 어떠한 포지션도 들고 있지 않은 상태에서
최초로 롱 포지션을 진입하는 시점(첫 포지션)에 대해:
기본적으로는 **자산의 100%**를 기준으로 포지션을 구축하지만,
만약 그 순간의 가격이 ATH 대비 설정값 이상(예: 약 –72.5% 이상 하락한 상황) 이라면
→ 자산의 300% 규모로 첫 포지션을 진입하도록 설계되어 있습니다.
이 규칙은 다음과 같이 동작합니다.
첫 진입이 1차 드로우다운 구간에서 발생하든,
첫 진입이 2차 드로우다운 구간에서 발생하든,
현재 하락폭이 설정된 기준 이상(예: –72.5% 이상) 이라면
→ “이 정도 하락이면 첫 진입부터 더 공격적으로 들어간다”는 의미로 300% 규모로 진입
그 이하의 하락폭이라면
→ 첫 진입은 100% 규모로 제한
즉, 전략은 다음 두 가지 모드로 동작합니다.
일반적인 상황의 첫 진입: 자산의 100%
심각한 드로우다운 구간에서의 첫 진입: 자산의 300%
이 특수 규칙은 깊은 하락에서는 공격적으로, 평소에는 상대적으로 보수적으로 진입하도록 설계된 것입니다.
3. 전략 동작 구조
3-1. 매수 조건
차트 상 High 기준으로 ATH를 추적합니다.
각 바마다 해당 ATH에서의 하락률을 계산합니다.
사용자가 설정한 두 개의 드로우다운 구간(예시):
1차 구간: 예를 들어 ATH – 50%
2차 구간: 예를 들어 ATH – 72.5%
각 구간에 대해 다음과 같은 조건을 확인합니다.
“이번 ATH 구간에서 아직 해당 구간 매수를 한 적이 없는 상태”이고,
현재 바의 저가(Low)가 해당 구간 가격 이하를 찍는 순간
→ 해당 바에서 매수 조건 충족으로 간주
실제 주문은:
해당 구간 가격에 맞춰 롱 포지션 진입(리밋/시장가 기반 시뮬레이션) 으로 처리됩니다.
3-2. ATH 갱신과 진입 기회 리셋
차트 상에서 새로운 고점(High)이 기존 ATH를 넘어서는 순간,
ATH가 갱신되고,
1차 / 2차 진입 여부를 나타내는 내부 플래그가 초기화됩니다.
이를 통해, 시장이 새로운 고점을 돌파해 나갈 때마다,
해당 구간에서 다시 한 번씩 1차·2차 드로우다운 진입 기회를 갖게 됩니다.
4. 포지션 사이징 및 레버리지
4-1. 계좌 자산(Equity) 기준 포지션 크기 결정
전략은 현재 계좌 자산을 다음과 같이 정의하여 사용합니다.
현재 자산 = 초기 자본 + 실현 손익 + 미실현 손익
각 진입 구간에서의 포지션 가치는 다음과 같이 결정됩니다.
1차 진입 구간:
“자산의 몇 %를 사용할지”를 설정값으로 입력
설정된 퍼센트를 계좌 자산에 곱한 뒤,
다시 전략 내 레버리지 배수(Leverage) 를 곱하여 실제 포지션 가치를 계산
2차 진입 구간:
동일한 방식으로, 독립된 퍼센트 설정값을 사용
즉, 포지션 가치는 다음과 같이 계산됩니다.
포지션 가치 = 현재 자산 × (해당 구간 설정 % / 100) × 레버리지 배수
그리고 이를 해당 구간의 진입 가격으로 나누어 실제 수량(토큰 단위) 를 산출합니다.
4-2. 첫 포지션의 예외 처리 (100% / 300%)
첫 포지션에 대해서는 위의 일반적인 퍼센트 설정 대신,
다음과 같은 고정 비율이 사용됩니다.
기본: 자산의 100% 규모로 첫 포지션 진입
단, 진입 시점의 ATH 대비 하락률이 설정값 이상(예: –72.5% 이상) 일 경우
→ 자산의 300% 규모로 첫 포지션 진입
이때 역시 다음 공식을 사용합니다.
포지션 가치 = 현재 자산 × (100% 또는 300%) × 레버리지
그리고 이를 가격으로 나누어 실제 진입 수량을 계산합니다.
이 규칙은:
첫 진입이 1차 구간이든 2차 구간이든 동일하게 적용되며,
“충분히 깊은 하락 구간에서는 첫 진입부터 더 크게,
평소에는 비교적 보수적으로” 라는 운용 철학을 반영합니다.
4-3. 실레버리지(Real Leverage)의 추적
전략은 각 바 단위로 다음을 추적합니다.
바가 시작할 때의 기존 포지션 크기
해당 바에서 새로 진입한 수량
이를 바탕으로, 진입이 발생한 시점에 다음을 계산합니다.
실제 레버리지 = (포지션 가치 / 현재 자산)
그리고 차트 상에 예를 들어:
Lev 2.53x 와 같은 형식의 레이블로 표시합니다.
이를 통해, 매수 시점마다 실제 계좌 레버리지가 어느 정도였는지를 직관적으로 확인할 수 있습니다.
5. 시각화 및 모니터링 요소
5-1. 차트 상 시각 요소
전략은 차트 위에 다음과 같은 정보를 직접 표시합니다.
ATH 라인
High 기준으로 계산된 역대 최고가를 주황색 선으로 표시
평단가(평균 진입가) 라인
현재 보유 포지션이 있을 때,
해당 포지션의 평균 진입가를 노란색 선으로 표시
추정 청산가(고정형 청산가) 라인
포지션 수량이 변화하는 시점을 감지하여,
당시의 평단가와 실제 레버리지를 이용해 근사적인 청산가를 계산
이를 빨간색 선으로 차트에 고정 표시
포지션이 없거나 레버리지가 1배 이하인 경우에는 청산가 라인을 제거
매수 마커 및 레이블
1차/2차 매수 조건이 충족될 때마다 해당 지점에 매수 마커를 표시
"Buy XX% @ 가격", "Lev XXx" 형태의 라벨로
진입 비율과 당시 레버리지를 함께 시각화
레이블의 위치는 설정에서 선택 가능:
바 아래 (Below Bar)
바 위 (Above Bar)
실제 가격 위치 (At Price)
5-2. 우측 상단 정보 테이블
차트 우측 상단에는 현재 계좌·포지션 상태를 요약한 정보 테이블이 표시됩니다.
대표적으로 다음 항목들이 포함됩니다.
Pos Qty (Token)
현재 보유 중인 포지션 수량(토큰 기준, 절대값 기준)
Pos Value (USDT)
현재 포지션의 시장 가치 (수량 × 현재 가격)
Leverage (Now)
현재 실레버리지 (포지션 가치 / 현재 자산)
DD from ATH (%)
현재 가격 기준, 최근 ATH에서의 하락률(%)
Avg Entry
현재 포지션의 평균 진입 가격
PnL (%)
현재 포지션 기준 미실현 손익률(%)
Max DD (Equity %)
전략 전체 기간 동안 기록된 계좌 기준 최대 손실(MDD, Max Drawdown)
Last Entry Price
가장 최근에 포지션을 추가로 진입한 직후의 평균 진입 가격
Last Entry Lev
위 “Last Entry Price” 시점에서의 실레버리지
Liq Price (Fixed)
위에서 설명한 고정형 추정 청산가
Return from Start (%)
전략 시작 시점(초기 자본) 대비 현재 계좌 자산의 총 수익률(%)
이 테이블을 통해 사용자는:
현재 계좌와 포지션의 상태
리스크 수준
누적 성과
를 직관적으로 파악할 수 있습니다.
6. 시간 필터 및 라벨 옵션
6-1. 전략 동작 기간 설정
전략은 옵션으로 특정 기간에만 전략을 동작시키는 시간 필터를 제공합니다.
“Use Date Range” 옵션을 활성화하면:
시작 시각과 종료 시각을 지정하여
해당 구간에 한해서만 매매가 발생하도록 제한
옵션을 비활성화하면:
전략은 전체 차트 구간에서 자유롭게 동작
6-2. 진입 라벨 위치 설정
사용자는 매수/레버리지 라벨의 위치를 선택할 수 있습니다.
바 아래 (Below Bar)
바 위 (Above Bar)
실제 가격 위치 (At Price)
이를 통해 개인 취향 및 차트 가독성에 맞추어
시각화 방식을 유연하게 조정할 수 있습니다.
7. 활용 대상 및 사용 예시
본 전략은 다음과 같은 목적에 적합합니다.
현물 또는 선물 롱 포지션 기준 장기·스윙 관점 추매 전략 백테스트
“고점 대비 하락률”을 기준으로 한 규칙 기반 운용 아이디어 검증
레버리지 사용 시
계좌 레버리지·청산가·MDD를 동시에 모니터링하고자 하는 경우
특정 자산에 대해
“새로운 고점이 형성될 때마다
일정한 규칙으로 깊은 조정 구간에서만 분할 진입하고자 할 때”
실거래에 그대로 적용하기보다는,
전략 아이디어 검증 및 리스크 프로파일 분석,
자신의 성향에 맞는 파라미터 탐색 용도로 사용하는 것을 권장합니다.
8. 한계 및 유의사항
백테스트 결과는 미래 성과를 보장하지 않습니다.
과거 데이터에 기반한 시뮬레이션일 뿐이며,
실제 시장에서는
유동성
슬리피지
수수료 체계
강제청산 규칙
등 다양한 변수가 존재합니다.
청산가는 단순화된 공식에 따른 추정치입니다.
거래소별 실제 청산 규칙, 유지 증거금, 수수료, 펀딩비 등은
본 전략의 계산과 다를 수 있으며,
청산가 추정 라인은 참고용 지표일 뿐입니다.
레버리지 및 진입 비율 설정에 따라 손실 폭이 매우 커질 수 있습니다.
특히 **“첫 포지션 300% 진입”**과 같이 매우 공격적인 설정은
시장 급락 시 계좌 손실과 청산 리스크를 크게 증가시킬 수 있으므로
신중한 검토가 필요합니다.
실거래 연동 시에는 별도의 리스크 관리가 필수입니다.
개별 손절 기준
포지션 상한선
전체 포트폴리오 내 비중 관리 등
본 전략 외부에서 추가적인 안전장치가 필요합니다.
9. 결론
ATH Drawdown Re-Buy Long Only 전략은 단순한 “저가 매수”를 넘어서,
ATH 기준으로 드로우다운을 구조적으로 활용하고,
첫 포지션에 대한 **특수 규칙(100% / 300%)**을 적용하며,
레버리지·청산가·MDD·수익률을 통합적으로 시각화함으로써,
하락 구간에서의 규칙 기반 롱 포지션 구축과
리스크 모니터링을 동시에 지원하는 전략입니다.
사용자는 본 전략을 통해:
자신의 시장 관점과 리스크 허용 범위에 맞는
드로우다운 구간
진입 비율
레버리지 설정
다양한 시나리오에 대한 백테스트와 분석
을 수행할 수 있습니다.
다시 한 번 강조하지만,
본 전략은 연구·학습·백테스트를 위한 도구이며,
실제 투자 판단과 책임은 전적으로 사용자 본인에게 있습니다.
/ENG Version.
This script is designed to use historical drawdown data and automatically enter positions when a predefined percentage drop from the all-time high occurs, using a predefined percentage of your account equity.
You can use leverage, and default parameter values are provided out of the box (you can freely change them to suit your style).
In addition to the two main entry levels, you can add more entry conditions and custom entry percentages – just ask ChatGPT to modify the script.
For actual/live usage, please turn OFF the KillSwitch function and turn ON the Bar Magnifier feature.
ATH Drawdown Re-Buy Long Only Strategy
1. Strategy Overview
The ATH Drawdown Re-Buy Long Only strategy is an automatic re-buy (Long Only) system that builds long positions step-by-step at specific drawdown levels, based on the asset’s all-time high (ATH) and its subsequent drawdown.
This strategy is designed with the following goals:
Systematic scaled buying and leverage usage during sharp correction periods
Clear, rule-based entry logic using drawdowns from ATH
Real-time visualization of:
Average entry price
Leverage
Estimated liquidation price
Account MDD (Max Drawdown)
Return / performance
This allows traders to intuitively monitor both risk and position status.
※ This strategy is provided for educational, research, and backtesting purposes only.
It does not constitute investment advice and does not guarantee any profits.
2. Core Concepts
2-1. Drawdown from ATH (All-Time High)
On the chart, the strategy always tracks the highest high as the ATH.
Whenever a new high is made, ATH is updated, and based on that ATH the following are calculated:
How many percent the current bar’s Low is below the ATH
How many percent the current bar’s Close is below the ATH
Using these, the strategy executes buys at two predefined drawdown zones:
1st entry zone: When price drops X% from ATH
2nd entry zone: When price drops Y% from ATH
Each zone is allowed to trigger only once per ATH cycle.
When a new ATH is created, the “1st / 2nd entry possible” flags are reset, and new opportunities open up for that ATH leg.
2-2. Special Rule for the First Position (100% / 300%)
A key feature of this strategy is the special rule for the very first position.
When the strategy currently holds no position and is about to open the first long position:
Under normal conditions, it builds the position using 100% of account equity.
However, if at that moment the price has dropped by at least a predefined threshold from ATH (e.g. around –72.5% or more),
→ the strategy will open the first position using 300% of account equity.
This rule works as follows:
Whether the first entry happens at the 1st drawdown zone or at the 2nd drawdown zone,
If the current drawdown from ATH is at or below the threshold (e.g. –72.5% or worse),
→ the strategy interprets this as “a sufficiently deep crash” and opens the initial position with 300% of equity.
If the drawdown is less severe than the threshold,
→ the first entry is capped at 100% of equity.
So the strategy has two modes for the first entry:
Normal market conditions: 100% of equity
Deep drawdown conditions: 300% of equity
This special rule is intended to be aggressive in extremely deep crashes while staying more conservative in normal corrections.
3. Strategy Logic & Execution
3-1. Entry Conditions
The strategy tracks the ATH using the High price.
For each bar, it calculates the drawdown from ATH.
The user defines two drawdown zones, for example:
1st zone: ATH – 50%
2nd zone: ATH – 72.5%
For each zone, the strategy checks:
If no buy has been executed yet for that zone in the current ATH leg, and
If the current bar’s Low touches or falls below that zone’s price level,
→ That bar is considered to have triggered a buy condition.
Order simulation:
The strategy simulates entering a long position at that zone’s price level
(using a limit/market-like approximation for backtesting).
3-2. ATH Reset & Entry Opportunity Reset
When a new High goes above the previous ATH:
The ATH is updated to this new high.
Internal flags that track whether the 1st and 2nd entries have been used are reset.
This means:
Each time the market makes a new ATH,
The strategy once again has a fresh opportunity to execute 1st and 2nd drawdown entries for that new ATH leg.
4. Position Sizing & Leverage
4-1. Position Size Based on Account Equity
The strategy defines current equity as:
Current Equity = Initial Capital + Realized PnL + Unrealized PnL
For each entry zone, the position value is calculated as follows:
The user inputs:
“What % of equity to use at this zone”
The strategy:
Multiplies current equity by that percentage
Then multiplies by the strategy’s leverage factor
Thus:
Position Value = Current Equity × (Zone % / 100) × Leverage
Finally, this position value is divided by the entry price to determine the actual position size in tokens.
4-2. Exception for the First Position (100% / 300%)
For the very first position (when there is no open position),
the strategy does not use the zone % parameters. Instead, it uses fixed ratios:
Default: Enter the first position with 100% of equity.
If the drawdown from ATH at that moment is greater than or equal to a predefined threshold (e.g. –72.5% or more)
→ Enter the first position with 300% of equity.
The position value is computed as:
Position Value = Current Equity × (100% or 300%) × Leverage
Then it is divided by the entry price to obtain the token quantity.
This rule:
Applies regardless of whether the first entry occurs at the 1st zone or 2nd zone.
Embeds the philosophy:
“In very deep crashes, go much larger on the first entry; otherwise, stay more conservative.”
4-3. Tracking Real Leverage
On each bar, the strategy tracks:
The existing position size at the start of the bar
The newly added size (if any) on that bar
When a new entry occurs, it calculates the real leverage at that moment:
Real Leverage = (Position Value / Current Equity)
This is then displayed on the chart as a label, for example:
Lev 2.53x
This makes it easy to see the actual leverage level at each entry point.
5. Visualization & Monitoring
5-1. On-Chart Visual Elements
The strategy plots the following directly on the chart:
ATH Line
The all-time high (based on High) is plotted as an orange line.
Average Entry Price Line
When a position is open, the average entry price of that position is plotted as a yellow line.
Estimated Liquidation Price (Fixed) Line
The strategy detects when the position size changes.
At each size change, it uses the current average entry price and real leverage to compute an approximate liquidation price.
This “fixed liquidation price” is then plotted as a red line on the chart.
If there is no position, or if leverage is 1x or lower, the liquidation line is removed.
Entry Markers & Labels
When 1st/2nd entry conditions are met, the strategy:
Marks the entry point on the chart.
Displays labels such as "Buy XX% @ Price" and "Lev XXx",
showing both entry percentage and real leverage at that time.
The label placement is configurable:
Below Bar
Above Bar
At Price
5-2. Information Table (Top-Right Panel)
In the top-right corner of the chart, the strategy displays a summary table of the current account and position status. It typically includes:
Pos Qty (Token)
Absolute size of the current position (in tokens)
Pos Value (USDT)
Market value of the current position (qty × current price)
Leverage (Now)
Current real leverage (position value / current equity)
DD from ATH (%)
Current drawdown (%) from the latest ATH, based on current price
Avg Entry
Average entry price of the current position
PnL (%)
Unrealized profit/loss (%) of the current position
Max DD (Equity %)
The maximum equity drawdown (MDD) recorded over the entire backtest period
Last Entry Price
Average entry price immediately after the most recent add-on entry
Last Entry Lev
Real leverage at the time of the most recent entry
Liq Price (Fixed)
The fixed estimated liquidation price described above
Return from Start (%)
Total return (%) of equity compared to the initial capital
Through this table, users can quickly grasp:
Current account and position status
Current risk level
Cumulative performance
6. Time Filters & Label Options
6-1. Strategy Date Range Filter
The strategy provides an option to restrict trading to a specific time range.
When “Use Date Range” is enabled:
You can specify start and end timestamps.
The strategy will only execute trades within that range.
When this option is disabled:
The strategy operates over the entire chart history.
6-2. Entry Label Placement
Users can customize where entry/leverage labels are drawn:
Below Bar (Below Bar)
Above Bar (Above Bar)
At the actual price level (At Price)
This allows you to adjust visualization according to personal preference and chart readability.
7. Use Cases & Applications
This strategy is suitable for the following purposes:
Long-term / swing-style re-buy strategies for spot or futures long positions
Testing rule-based strategies that rely on “drawdown from ATH” as a main signal
Monitoring account leverage, liquidation price, and MDD when using leverage
Handling situations where, for a given asset:
“Every time a new ATH is formed,
you want to wait for deep corrections and enter only at specific drawdown zones”
It is generally recommended to use this strategy not as a direct plug-and-play live system, but as a tool for:
Strategy idea validation
Risk profile analysis
Parameter exploration to match your personal risk tolerance and style
8. Limitations & Warnings
Backtest results do not guarantee future performance.
They are based on historical data only.
In live markets, additional factors exist:
Liquidity
Slippage
Fee structures
Exchange-specific liquidation rules
Funding fees, etc.
The liquidation price is only an approximate estimate, derived from a simplified formula.
Actual liquidation rules, maintenance margin requirements, fees, and other details differ by exchange.
The liquidation line should be treated as a reference indicator, not an exact guarantee.
Depending on the configured leverage and entry percentages, losses can be very large.
In particular, extremely aggressive settings such as “first position 300% of equity” can greatly increase the risk of large account drawdowns and liquidation during sharp market crashes.
Use such settings with extreme caution.
For live trading, additional risk management is essential:
Your own stop-loss rules
Maximum position size limits
Portfolio-level exposure controls
And other external safety mechanisms beyond this strategy
9. Conclusion
The ATH Drawdown Re-Buy Long Only strategy goes beyond simple “buy the dip” logic. It:
Systematically utilizes drawdowns from ATH as a structural signal
Applies a special first-position rule (100% / 300%)
Integrates visualization of leverage, liquidation price, MDD, and returns
All of this supports rule-based long position building in drawdown phases and comprehensive risk monitoring.
With this strategy, users can:
Explore different:
Drawdown zones
Entry percentages
Leverage levels
Run various backtests and scenario analyses
Better understand the risk/return profile that fits their own market view and risk tolerance
Once again, this strategy is intended for research, learning, and backtesting only.
All real trading decisions and their consequences are solely the responsibility of the user.

Setup: Smooth Gaussian + Adaptive Supertrend (Manual Vol)Overview
This strategy combines two powerful trend-based tools originally developed by Algo Alpha: the Smooth Gaussian Trend (simulated) and the Adaptive Supertrend. The objective is to capture sustained bullish movements in periods of controlled volatility by filtering for high-probability entries.
Entry Logic
Long Entry Conditions:
The closing price is above the Smooth Gaussian Trend line (with length = 75), and
The volatility setting from the Adaptive Supertrend is manually defined as either 2 or 3
Exit Condition:
The closing price falls below the Smooth Gaussian Trend line
This script uses a simulated version of the Gaussian Trend line via double-smoothed SMA, as the original Algo Alpha indicator is protected and cannot be accessed directly in code.
Features
Plots entry and exit signals directly on the chart
Manual toggle to enable or disable the volatility filter
Lightweight design to allow flexible backtesting even without access to proprietary indicators
Important Note
This strategy does not connect to the actual Adaptive Supertrend from Algo Alpha. Users must manually input the volatility level based on what they observe on the chart when the original indicator is also applied. The Smooth Gaussian Trend is approximated and may differ slightly from the original.
Suggested Use
Recommended timeframes: 1H, 4H, or Daily
Best used alongside the original indicators displayed on the chart
Consider incorporating additional structure, momentum, or volume filters to enhance performance
If you have suggestions or would like to contribute improvements, feel free to reach out or fork the script.

RSI Pro+ (Bear market, financial crisis and so on EditionIn markets defined by volatility, fear, and uncertainty – the battlegrounds of bear markets and financial crises – you need tools forged in resilience. Introducing RSI Pro+, a strategy built upon a legendary indicator born in 1978, yet engineered with modern visual clarity to remain devastatingly effective even in the chaotic financial landscapes of 3078.
This isn't about complex algorithms predicting the unpredictable. It's about harnessing the raw, time-tested power of the Relative Strength Index (RSI) to identify potential exhaustion points and capitalize on oversold conditions. RSI Pro+ cuts through the noise, providing clear, actionable signals when markets might be poised for a relief bounce or reversal.
Core Technology (The 1978 Engine):
RSI Crossover Entry: The strategy initiates a LONG position when the RSI (default period 11) crosses above a user-defined low threshold (default 30). This classic technique aims to enter when selling pressure may be waning, offering potential entry points during sharp downturns or periods of consolidation after a fall.
Modern Enhancements (The 3078 Cockpit):
RSI Pro+ isn't just about the signal; it's about providing a professional-grade visual experience directly on your chart:
Entry Bar Highlight: A subtle background flash on the chart signals the exact bar where the RSI crossover condition is met, alerting you to potential entry opportunities.
Trade Bar Coloring: Once a trade is active, the price bars are subtly colored, giving you immediate visual confirmation that the strategy is live in the market.
Entry Price Line: A clear, persistent line marks your exact average entry price for the duration of the trade, serving as a crucial visual anchor.
Take Profit Line: Your calculated Take Profit target is plotted as a distinct line, keeping your objective clearly in sight.
Custom Entry Marker: A precise shape (▲) appears below the bar where the trade entry was actually executed, pinpointing the start of the position.
On-Chart Info Table (HUD): A clean, customizable Heads-Up Display appears when a trade is active, showing vital information at a glance:
Entry Price: Your position's average cost basis.
TP Target: The calculated price level for your Take Profit exit.
Current PnL%: Real-time Profit/Loss percentage for the open trade.
Full Customization: Nearly every aspect is configurable via the settings menu:
RSI Period & Crossover Level
Take Profit Percentage
Toggle ALL visual enhancements on/off individually
Position the Info Table wherever you prefer on the chart.
How to Use RSI Pro+:
Add to Chart: Apply the "RSI Pro+ (Bear market...)" strategy to your TradingView chart. Ensure any previous versions are removed.
Access Settings: Click the cogwheel icon (⚙️) next to the strategy name on your chart.
Configure Inputs (Crucial Step):
RSI Crossover Level: This is key. The default (30) targets standard oversold conditions. In severe downturns, you might experiment with lower levels (e.g., 25, 20) or higher ones (e.g., 40) depending on the asset and timeframe. Observe where RSI(11) typically bottoms out on your chart.
Take Profit Percentage (%): Define your desired profit target per trade (e.g., enter 0.5 for 0.5%, 1.0 for 1%). The default is a very small 0.11%.
RSI Period: While default is 11, you can adjust this (e.g., the standard 14).
Visual Enhancements: Enable or disable the visual features (background highlights, bar coloring, lines, markers, table) according to your preference using the checkboxes. Adjust table position.
Observe & Backtest: Watch how the strategy behaves on your chosen asset and timeframe. Use TradingView's Strategy Tester to analyze historical performance based on your settings. No strategy works perfectly everywhere; testing is essential.
Important Considerations:
Risk Management: This specific script version focuses on a Take Profit exit. It does not include an explicit Stop Loss. You MUST manage risk through appropriate position sizing, potentially adding a Stop Loss manually, or by modifying the script.
Oversold ≠ Reversal: An RSI crossover is an indicator of potential exhaustion, not a guarantee of a price reversal.
Fixed TP: A fixed percentage TP ensures small wins but may exit before larger potential moves.
Backtesting Limitations: Past performance does not guarantee future results.
RSI Pro+ strips away complexity to focus on a robust, time-honored principle, enhanced with modern visuals for the discerning trader navigating today's (and tomorrow's) challenging markets

CE_ZLSMA_5MIN_CANDLECHART-- Overview
The "CE_ZLSMA_5MIN_CANDLECHART" strategy, developed by DailyPanda, is a comprehensive trading strategy designed for analyzing trading on 5-minute candlestick charts.
It aims to use some indicators calculated from a Hekin Ashi chart, while running it on a normal candlestick chart, making sure that no price distortion affects the strategy results .
It also brings a feature to show, on the candlestick chart, where the entries would take place on the HA chart, to also be able to study the effect that the price distortion would make on your backtest.
-- Credit
The code in this script is based on open-source indicators originally written by veryfid and everget, I've made significant changes and additions to the scripts but all credit for the idea goes to them, I just built on top of it:
-- Key Features
It incorporate already built indicators (ZLSMA) and CandelierExit (CE)
-- Zero Lag Least Squares Moving Average (ZLSMA) - by veryfid
The ZLSMA is used to detect trends with minimal lag, improving the accuracy of entry and exit signals.
It incorporates a double-smoothed linear regression to minimize lag and enhance trend-following capabilities.
Buy signals are generated when the price closes above the ZLSMA together with the CE signal.
It is calculated based on the HA candlestick pattern.
-- Chandelier Exit (CE) - by everget
The Chandelier Exit indicator is used to dynamically manage stop-loss levels based on the Average True Range (ATR).
It ensures that stop-loss levels are adaptive to market volatility, protecting profits and limiting losses.
The ATR period and multiplier can be customized to fit different trading styles and risk tolerances.
It is calculated based on the HA candlestick pattern.
-- Heikin Ashi Candles
The strategy leverages Heikin Ashi candlesticks to be able identify trends more clearly and leverage this to stay on winning trades longer.
Traders can choose to display Heikin Ashi candlesticks and order fills on the chart for better visualization.
-- Risk Management
The strategy includes multiple risk management options to protect traders' capital.
Maximum intraday loss limit based on a percentage of equity.
Maximum stop-loss in points to filter out entries with excessive risk.
Daily profit target to stop trading once the goal is achieved.
Options to use fixed contract sizes or dynamically adjust based on a percentage of equity.
These features help traders manage risk and ensure sustainable trading practices.
Moving Averages
Several moving averages (EMA 9, EMA 20, EMA 50, EMA 72, EMA 200, SMA 200, and SMA 500) are plotted to provide additional context and trend confirmation.
A "Zone of Value" is highlighted between the EMA 200 and SMA 200 to identify potential support and resistance areas.
-- Customizable Inputs
The strategy includes various customizable inputs, allowing traders to tailor it to their specific needs.
Start and stop trading times.
Risk management parameters (e.g., maximum stop-loss, daily drawdown limit, and daily profit target).
Display options for Heikin Ashi candles and moving averages.
ZLSMA length and offset.
-- Usage
-- Setting Up the Strategy
Configure the start year for the strategy and the trading hours using the input fields. The first candle of each day will be filled black for easy identification, while candles that are outside the allowed time range will be filled purple.
Customize the risk management parameters to match your risk tolerance and trading style.
Enable or disable the display of Heikin Ashi candlesticks and moving averages as desired.
-- Interpreting Signals
Buy signals are indicated by a "Buy" label when the Heikin Ashi close price is above the ZLSMA and the Chandelier Exit indicates a long position.
The strategy will automatically enter a long position with a stop-loss level determined the swing low.
Positions are closed when the close price falls below the ZLSMA.
-- Risk Management
The strategy monitors the maximum intraday loss and stops trading if the loss limit is reached.
If enabled, also stops trading once the daily profit target is achieved, helping to lock in gains.
You have the option to filter operations based on a maximum accepted stop-loss level, based on your risk tolerance.
You can also operate with a fixed amount of contracts or dynamically adjust it based on your allowed risk per trade, ensuring optimal protection of capital.
-- Visual Aids
The strategy plots various moving averages to provide additional trend context.
The "Zone of Value" between the EMA 200 and SMA 200 highlights potential support and resistance areas.
Heikin Ashi candlesticks and order fills can be displayed to enhance the difference this strategy would take if you were to backtest it on a Heikin Ashi chart.
-- Table of results
This strategy also breaks down the results on a monthly basis for better understanding of your capital development along the way.
-- Conclusion
The "CE_ZLSMA_5MIN_CANDLECHART" strategy is a tool for intraday traders looking to understand and leaverage the Heikin Ashi chart while still using the normal candle chart. Traders can customize the strategy to fit their specific needs, making it a versatile addition to any trading toolkit.

GT 5.1 Strategy═════════════════════════════════════════════════════════════════════════
█ OVERVIEW
People often look an indicator in their technical analysis to enter a position. We may also need to look at the signals of one or more indicators to verify the signals given by some indicators. In this context, I developed a strategy to test whether it really works by choosing some of the indicators that capture trend changes with the same characteristics. Also, since the subject is to catch the trend change, I thought it would be right to include an indicator using the heikin ashi logic. By averaging and smoothing the market noise, Heiken Ashi makes it easier to detect the direction of the trend helps to see possible reversal points on the chart. However, it should be noted that Heiken Ashi is a lagging indicator.
I picked 5 different indicators (but their purpose are similar) and combined them to produce buy and sell signals based on your choice(not repaint). First of all let's get some information about our indicators. So you will understand me why i picked these indicators and what is the meaning of their signals.
1 — Coral Trend Indicator by LazyBear
Coral Trend Indicator is a linear combination of moving averages, all obtained by a triple or higher order exponential smoothing. The indicator comes with a trend indication which is based on the normalized slope of the plot. the usage of this indicator is simple. When the color of the line is green that means the market is in uptrend. But when the color is red that means the market is in downtrend.
As you see the original indicator it is simple to find is it in uptrend or downtrend.
So i added a code to find when the color of the line change. When it turns green to red my script giving sell signals, when it turns red to green it gives buy signals.
I hide the candles to show you more clearly what is happening when you choose only Coral Strategy. But sometimes it is not enough only using itself. Even if green dots turn to red it continues in uptrend. So we need a to look another indicator to approve our signal.
2 — SSL channel by ErwinBeckers
Known as the SSL , the Semaphore Signal Level channel is an indicator that combines moving averages to provide you with a clear visual signal of price movement dynamics. In short, it's designed to show you when a price trend is forming. This indicator creates a band by calculating the high and low values according to the determined period. Simply if you decide 10 as period, it calculates a 10-period moving average on the latest 10 highs. Calculate a 10-period moving average on the latest 10 lows. If the price falls below the low band, the downtrend begins, if the price closes above the high band, the uptrend begins. Lets look the original form of indicator and learn how it using.
If the red line is below and the green band is above, it means that we are in uptrend, and if it is on the opposite side, it means that we are in downtrend. Therefore, it would be logical to enter a position where the trend has changed. So i added a code to find when the crossover has occured.
As you see in my strategy, it gives you signals when the trend has changed. But sometimes it is not enough only using this indicator itself. So lets look 2 indicator together in one chart.
Look circle SSL is saying it is in downtrend but Coral is saying it has entered in uptrend. if we just look to coral signal it can misleads us. So it can be better to look another indicator for validating our signals.
3 — Heikin Ashi RSI Oscillator by JayRogers
The Heikin-Ashi technique is used by technical traders to identify a given trend more easily. Heikin-Ashi has a smoother look because it is essentially taking an average of the movement. There is a tendency with Heikin-Ashi for the candles to stay red during a downtrend and green during an uptrend, whereas normal candlesticks alternate color even if the price is moving dominantly in one direction. This indicator actually recalculates the RSI indicator with the logic of heikin ashi. Due to smoothing, the bars are formed with a slight lag, reflecting the trend rather than the exact price movement. So lets look the original version to understand more clearly. If red bars turn to green bars it means uptrend may begin, if green bars turn to red it means downtrend may begin.
As you see HARSI giving lots of signal some of them is really good but some of them are not very well. Because it gives so much signals Now i will change time period and lets look same chart again.
Now results are better because of heikin ashi's logic. it is not suitable for day traders, it gives more accurate result when using the time period is longer. But it can be useful to use this indicator in short time periods using with other indicators. So you may catch the trend changes more accurately.
4 — MACD DEMA by ToFFF
This indicator uses a double EMA and MACD algorithm to analyze the direction of the trend. Though it might seem a tough task to manage the trades with the help of MACD DEMA once you know how the proper way to interpret the signal lines, it will be an easy task.
This indicator also smoothens the signal lines with the time series algorithm which eventually makes the higher time frame important. So, expecting better results in the lower time frame can result in big losses as the data reading from the MACD DEMA will not be accurate. In order to understand the function of this indicator, you have to know the functions of the EMA also.
The exponential moving average tends to give more priority to the recent price changes. So, expecting better results when the volatility is very high is a very risky approach to trade the market. Moreover, the MACD has some lagging issues compared to the EMA, so it is super important to use a trading method that focuses on the higher time frame only. What does MACD 12 26 Close 9 mean? When the DEMA-9 crosses above the MACD(12,26), this is considered a bearish signal. It means the trend in the stock – its magnitude and/or momentum – is starting to shift course. When the MACD(12,26) crosses above the DEMA-9, this is considered a bullish signal. Lets see this indicator on Chart.
When the blue line crossover red line it is good time to buy. As you see from the chart i put arrows where the crossover are appeared.
When the red line crossover blue line it is good time to sell or exit from position.
5 — WaveTrend Oscillator by LazyBear
This is a technical indicator that creates high and low bands between two values. It then creates a trend indicator that draws waves with highs and lows within these boundaries. WaveTrend is a widely used indicator for finding direction of an asset.
Calculation period: number of candles used to calculate WaveTrend, defaults to 10. Averaging period: number of candles used to average WaveTrend, defaults to 21.
As you see in chart when the lines crossover occured my strategy gives buy or sell signals.
═════════════════════════════════════════════════════════════════════════
█ HOW TO USE
I hope you understand how the indicators I mentioned above work and what they are used for. Now, I will explain in detail how to use the strategy I have created.
When you enter the settings section, you will see 5 types of indicators. If you want to use the signals of the indicators, simply tick the box next to the indicators. Also, under each option there is an area where you can set the "lookback". This setting is a field that will make the signals overlap when you select more than one option. If you are going to trade with only one option, you should make sure that this field is 0. Otherwise, it may continue to generate as many signals as you choose.
Lets see in chart for easy understanding.
As you see chart, if i chose only HARSI with lookback 0 (HARSI and CORAL should be 1 minumum because of algorithm-we looking 1 bar before, others 0 because we are looking crossovers), it will give signals only when harsı bar's color changed. But when i changed Lookback as 7 it will be like this in chart.
Now i will choose 2 indicator with settings of their lookback 0.
As you see it will give signals when both of them occurs same time. But HARSI is an indicator giving very early signal so we can enter position 5-6 bars after the first bar color change. So i will change HARSI Lookback settings as 7. Lets look what happens when we use lookback option.
So it wil be useful to change lookback settings to find best signals in each time period and in each symbol. But it shouldnt be too high. Because you can be late to catch trend's starting.
this is an image of MACD and WAVE trend used and lookback option are both 6.
Now lets see an example with 3 options are chosen with lookback option 11-1-5
Now lets talk about indicators settings. After strategy options you will see each indicators settings, you can change their settings as you desired. So each indicators signal will be changed according to your adjustment.
I left strategy options with default settings. You can change it manually as if you want.
═════════════════════════════════════════════════════════════════════════
█ LIMITATIONS: Don't rely on non-standard charts results. For example Heikin Ashi is a technical analysis method used with the traditional candlestick chart.Heikin Ashi vs. Candlestick Chart: The decisive visual difference between Heikin Ashi and the traditional chart is that Heikin Ashi flattens the traditional candlestick chart using a modified formula.
The primary advantage of Heikin Ashi is that it makes the chart more reader-friendly and helps users identify and analyze trends .
Because Heikin Ashi provides averaged price information rather than real-time price and reacts slowly to volatility — not suitable for scalpers and high-frequency traders. I added HARSI indicator as a supportive signal because it is useful with using CORAL and SSL channel indicators. If you change your candle types to Heikin Ashi , your profit will change in good way but dont rely on it.
═════════════════════════════════════════════════════════════════════════
█ THANKS:
Special thanks to authors of the scripts that i used.
@LazyBear and @ErwinBeckers and @JayRogers and @ToFFF
═════════════════════════════════════════════════════════════════════════
█ DISCLAIMER
Any trade decisions you make are entirely your own responsibility.

Straight Trend V1Hello everyone,
We are proud to present you our "Straight Trend" Strategy.
Strategy is use a specified timeline's opening price as reference and draw a line between the current price and trend line.
Trend line is smoothed with last X times of highest and lowest values ( Donchian Methodology) in order to create less noise and fake alerts , therefore creates a channel of current prices time based opening price.
The timeline can be adjusted according to your specifications in the settings.
------
Why opening price ?
We are traders ,no matter what we do ,we always make a benchmark at the end of a day , week or at the end of a specified time line.
Example :
X commodity's price increased %15 in last days or Y commodity's price dropped %30 in last 2 weeks etc. etc.
Thats why the opening price have a hidden and much more important role in our trading sessions.
------
After the channel is created we remove the unnecessary lines from our output by filtering the direction with closing price.
IF the closing price is higher than Chanel reference price and direction goes upward the script gives you a BUY signal.
The same methodology is applied for SELL operations.
When to Take Profit?
We put a setting for profit percentage in scripts setting you can adjust the ratio as your choices.
When to Stop Loss or change direction of the trade?
The Straight Trends previously mentioned channel's inverse line was set as STOP LOSS and direction changer in the strategy with "STR-X" Marker.
Note : Strategy is much more effective with heikin-ashi bars due methodology of heikin ashi and with this bars it creates less signals with more accuracy, use at your own discretion.
Please don't hesitate to write us if you need support or assistance, we also appreciate your feedbacks.
Please be advised that this strategy is published with Educational Purposes and it is not a investment advice.
Thank you in advance.
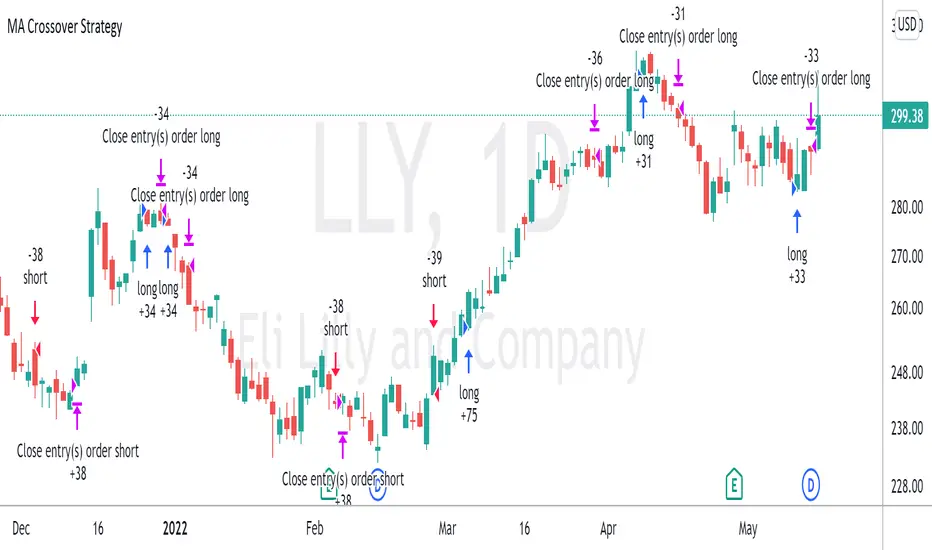
Moving Average Crossover StrategyThe Moving Average Crossover indicator uses 3 moving averages (2 simple moving averages and 1 exponential moving average ) to signal long and short opportunities based on moving average crossovers. This strategy serves as a backtest to that indicator. By taking entry and exit positions based on moving average crossovers, we are able to project profit with this script. You are given the option to select which moving average crossings trigger entry and exit signals. Fast refers to an EMA which should be your shortest MA. Slow refers to the first SMA which will serve as a signal line. Trend refers to a long SMA which will help determine if you should take long positions or short. You can also filter by extra conditions such as minimum volume or RSI. For example, you may have the script trigger a buy signal if the 5ema crosses the 20 sma while RSI reads 60 and sell if it crosses again.
This strategy starts with $100,000 and uses 10% of the account per trade.
Intraday Grid trading exampleHello everyone,
This was a grid trading example for intraday trading.
Please be advised that every commodity have diferent kind of reaction and rate of change between periods therefore the percentages need to be adjusted acording to the commodities change %.
In order to specify the adjustment rate we add the Zig Zag in the script.
For Example ;
Last 3 days zigzag high points are %25 , %13 and %8 , the average %is about %9 therefore you have to put the adjustment ratios something like;
Z%1 = %3
Z%2 = %6
Z%3 = %9
Feel free to use the script with caution( it was not a investment advice), this was only a example of grid trading strategy on our trading platform.
Regards.
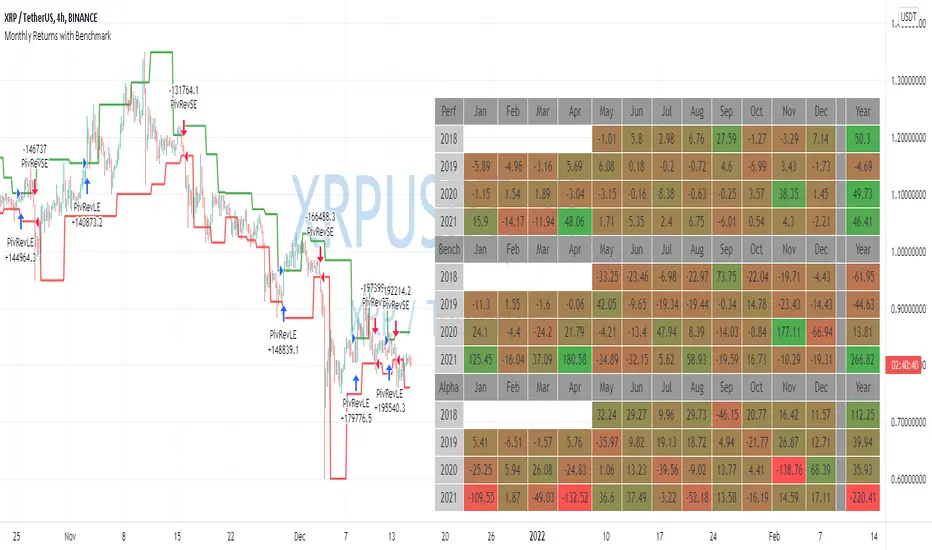
Monthly Returns with BenchmarkI keep working on trying to make TradingView strategies look fancier.
A few months ago I published the first version of the Monthly Returns for Strategies in Pine Script. I received quite a lot of good feedback and quite a lot of requests to update it.
This is a more advanced version of the Monthly Returns, in it, you can:
Display monthly returns of your strategy, benchmark, and alpha over this benchmark.
Select benchmark to be another instrument
Select the date from which you want to compute monthly returns
Show/hide benchmark and alpha
Choose colors for gradient for gain/loss values
Use it with any type of strategy
Use it with replay
I hope it will be useful for you.
It's not about the strategy itself but the way you display returns on your chart. So pls don't critique my choice of the strategy and its performance 🙂
Disclaimer
Please remember that past performance may not be indicative of future results.
Due to various factors, including changing market conditions, the strategy may no longer perform as well as in historical backtesting.
This post and the script don’t provide any financial advice.
TradePro's Trading Idea Cipher Divergence EMA Pb StrategyHere I present you on of Trade Pro's Trading Idea: Cipher B+ Divergence EMA Pullback Strategy.
Optimized the crypto pairBTC/USDT in the 30 minute chart.
There is the possibility to switch between short and long positions.
You can choose between 2 different take profit/stop loss types: The Lowest Low/ Highest High Stop Loss/ Take Profit and the ATR Take Profit/ Stop Loss.
-----------------------------------------------------------------------------------
How does the strategy work?
ENTRY
Long
The price must be above the 200 EMA .
The price needs to make a pullback into the 50 EMA .
Right after that, the Cipher B indicator must give a buy signal, it must be below the zero line and the Money Flow cloud must be green.
Short
Contrary to the premise of long positions.
EXIT
Lowest Low/ Highest High Exit
The Lowest Low (long) / highest high (short) serves as the stop loss. The TP is formed on the basis of a factor.
(Long for example: *Lowest Low* multiplied by *Profitfactor* = TP).
ATR Exit
The value of ATR at the time of buying is multiplied by the value entered in "Profit factor ATR" and "Stop factor ATR". As soon as the price reaches this value, it is closed.
Important
The script must be optimized for each coin or currency pair. However, only the values for the profit factor, the stop loss and Lowest Low / Highest High are relevant.
Also, by changing the Chanel Length and the Chanel Average, you can create strong profit changes.
The results of the strategy are without commissions and leverage.
If you have any questions or feedback, please let me know in the comments.
If you need more information about the strategy and want to know exactly how to apply it, check out my profile. There I have created a tutorial for the function of the script.

Breakout Trend Follower StrategyThis strategy goes long when highs are broken and uses a trailing stop that follows swing lows. User can configure a back test date range and choose whether or not to only take trades above a selected moving average.
The desire for me to make this script was to try to capture those extreme breakouts that can occur after a consolidation/equilibrium pattern. This catches those using stop-buys as the entry. Out of all the scripts I have made thus far, this one is the one that has the best results. Time frames might vary due to commission structures, etc. I currently use this strategy on stocks on the 30-min time frame and crypto (with Coinbase's high fees) on the 2-hr time frame.

2-Period RSI strategy (with filter)2-period RSI strategy backtest described in several books of the trader Larry Connors . This strategy uses a 2 periods RSI , one slow arithmetic moving average and one fast arithmetic moving average.
Entry signal:
- RSI 2 value below oversold level (Larry Connors usually sets oversold to be below 5, but other authors prefer to work below 10 due to the higher number of signals).
- Closing above the slow average (200 periods).
- Entry at closing of candle or opening of next candle.
Exit signal:
- Occurs when the candlestick closes above the fast average (the most common fast average is 5 periods, but some traders also suggest the 10 period average).
Entry Filter (modification made by me):
- Applied an RSI2 arithmetic moving average to smooth out oscillations.
- Entered only when RSI2 is below oversold level and RSI2 moving average is below 30.
* NOTE: In the stocks that I evaluate daily the averages of 4 and 6 periods work very well as a filter.
Comments:
This strategy works very well in Daily charts but can be applied in other chart times as well. As this is a strategy to catch market fluctuations, it presents different results with different stocks.
I have been applying this strategy to the stocks of the Brazilian market (BOVESPA) and have enjoyed the result. Every day I evaluate the stocks that are generating entry signals and choose which one to trade based on the stocks with the highest Profit Value.
The RSI 2 averaging filter probably will reduce profit of the backtests because reduces the number of signals, but the Profit Value will usually increase. For me this was a good thing because without the filter, this strategy usually shows more signals than I have capital to allocate.
Before entering a trade I look at which fast average the paper has the highest Profit Value and then I use this average as my output signal for that trade (this change has greatly improved the result of the outputs).
This strategy does not use Stop Loss because normally Stop Loss decreases effectiveness (profit). In any case, the option to apply a percentage Stop Loss if desired is added in the script. As the strategy does not use stop, extra caution with risk management is advisable. I advise not to allocate more than 20% of the trade capital in the same operation.
I'm still studying ways to improve this strategy, but so far this is the best setup I've found. Suggestions are always welcome and we can test to see if they improve the backtest result.
Good luck and good trades.
================================================
Backtest das estratégia do IFR de 2 períodos descrita em varios livros do trader Larry Connors . Esta estratégia usa um IFR de 2 períodos, uma média movel aritmética lenta e uma média movel aritmética rápida.
Sinal de entrada:
- Valor do IFR 2 abaixo do nível de sobrevenda (Larry Connors usualmente define sobrevenda sendo abaixo de 5, mas outros autores preferem trabalhar abaixo de 10 devido ao maior número de sinais).
- Fechamento acima da média lenta (200 períodos).
- Realizado a compra no fechamento do candle ou na abertura do candle seguinte.
Sinal de saída:
- Ocorre quando o candle fecha acima da média rápida (a média rápida mais comum é a de 5 períodos, mas alguns traders sugerem também a média de 10 períodos).
Filtro para entrada (modificação feita por mim):
- Aplicado uma média móvel aritmética do IFR2 para suavisar as oscilações.
- Realizado a entrada apenas quando o IFR2 está abaixo do nível de sobrevenda e a média móvel do IFR2 está abaixo de 30.
*OBS: nos ativos que avalio diariamente as médias de 4 e 6 períodos funcionam muito bem como filtro.
Comentários:
Esta estratégia funciona muito bem no tempo gráfico Diário mas pode ser aplicada tambem em outros tempos gráficos. Como trata-se de uma estratégia para pegar oscilações do mercado, ela apresenta diferentes resultados com diferentes ativos.
Eu venho aplicando esta estratégia nos ativos do mercado brasileiro (BOVESPA) e tenho gostado do resultado. Diariamente eu avalio os papeis que estão gerando entrada e escolho qual irei realizar o trade baseado nos papeis que apresentam maior Profit Value.
O filtro da média do IFR 2 reduz o lucro nos backtests pois reduz também a quantidade de sinais, mas em compensação o Profit Value irá normalmente aumentar. Para mim isto foi algo positivo pois, sem o filtro, normalmente esta estratégia apresenta mais sinais do que possuo capital para alocar.
Antes de entrar em um trade eu olho em qual média rápida o papel apresenta maior Profit Value e então eu utilizo está média como meu sinal de saída para aquele trade (esta mudança tem melhorado bastante o resultado das saídas).
Está estratégia não utiliza Stop Loss pois normalmente o Stop Loss diminui a eficácia (lucro). De qualquer maneira, foi acrescentado no script a opção de aplicar um Stop Loss percentual caso seja desejado. Como a estratégia não utiliza stop é aconselhável um cuidado redobrado com o gerenciamento de risco. Eu aconselho não alocar mais de 20% do capital de trade em uma mesma operação.
Ainda estou estudando formas de melhorar esta estratégia, mas até o momento está é a melhor configuração que encontrei. Sugestões são sempre bem vindas e podemos testar para verificar se melhoram o resultado do backtest.
Boa sorte e bons trades.

Moving Average Cross and/or Bbands botHello TradingView and world!
This is one of our latest concepts for an actual bot builder. This script comes with a bunch of features that we're hoping will alleviate a lot of the stress and confusion around using and building strategies here on TV. Especially if the end-goal is to automate the strategies using Autoview.
This is a combination of 2 strategies, and gives you full control of each component within the script.
The 2 strategies are:
2 Moving Averages == if close is greater than moving average and moving average 1 is greater than moving average 2
Bolling Bands == if close is less than lower or greater than upper
Features / Settings included :
- Ability to change settings from a commodity market (default) to an altcoin or forex market.
- Backtest time period selector component
- Heiken Ashi Candles on/off
- Moving Average Strategy on/off
- Bollinger Bands Strategy on/off
- Both Moving Average settings can be adjusted
- Bollinger Bands length and multiplier can be adjusted.
- Pyramiding Greater Than, Equal To, or Less Than
- Trailing Stop with the ability to set a price in which the Trailing Stop activate
- Take Profit on/off and editable
- Stop Loss on/off and editable
- Margin Call on/off dependent on Leverage which is editable
- If pyramiding is used, the strategy will calculate and display your average on the chart
- Profit and Loss visuals added to the chart
You can watch a video here on how all the settings can be used and work together.
www.youtube.com
You can learn more about Autoview here:
autoview.with.pink
Get your invite and join us in slack here:
slack.with.pink
